
1.2. 3D View#
Since the data are measured in two different ways, namely by UV absorbance and X-ray scattering, they can be expressed as a whole in 3D plots as follows.
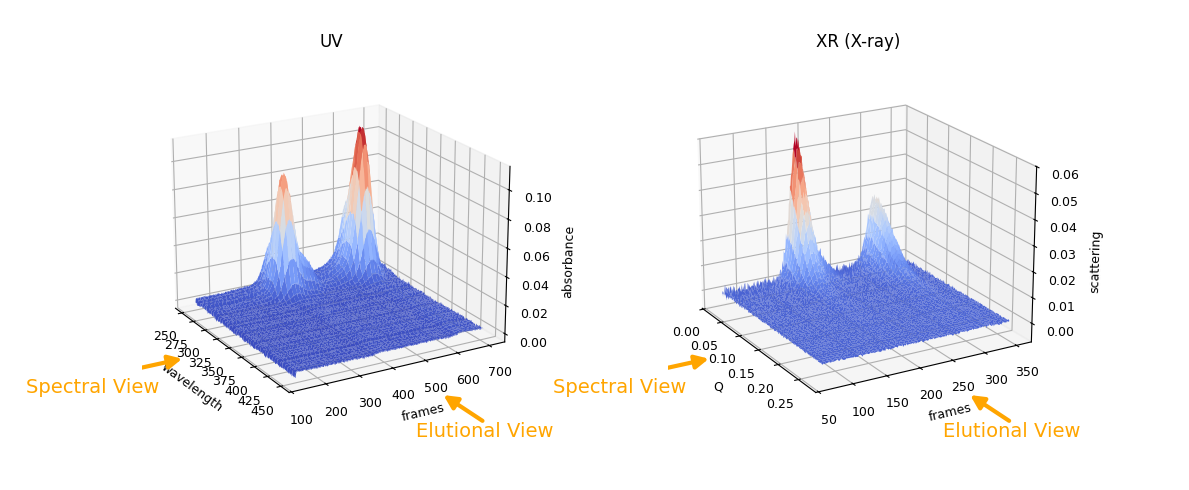
Fig. 1.1 3D view of SEC-SAXS data#
Observe here, the following points. Contrasted between UV and X-ray:
In the spectral view, horizontal coordinates are measured in different variables, namely wavelength and scattering angle (Q: momentum transfer).
In the elutional view, horizontal coordinates are measured in similar variables, namely frames, but not necessarily with the same intervals.
Peak height proportions are different. That is, the first peak is taller in UV while it is shorter in X-ray.
Note
We say here, for lack of a better word, “spectral” to suggest the same direction for both of absorbance and scattering data. For the latter, “angular” might be used in other contexts since the Q-axis represents the scattering angle, or presicely, momentum transfer \( q = 4 \pi \sin(\theta)/\lambda \), where \( 2\theta \) is the scattering angle and \(\lambda\) the incident X-ray wavelength.