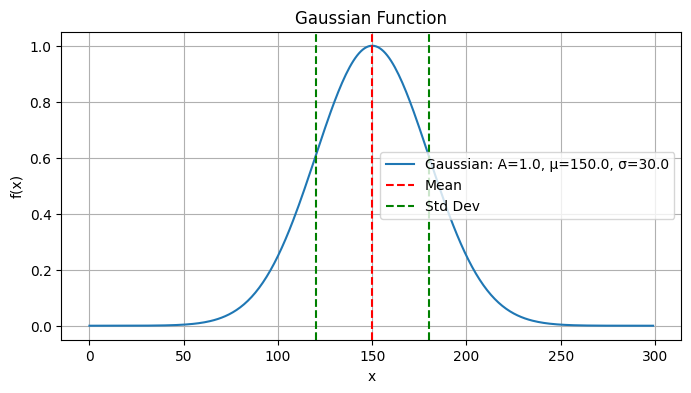
The simplest elution curve model is Gaussian.
Confirm the basic properties and relation between the peak width and the standard deviation by running the following code snipets.
import numpy as np
def gaussian(x, A=1.0, mu=0.0, sigma=1.0):
    return A * np.exp(-((x - mu)**2/(2*sigma**2)))
x = np.linspace(-5, 5, 100)
y = gaussian(x, A=1.0, mu=0.0, sigma=1.0)
w = np.sum(y)
mean = np.sum(x * y) / w
variance = np.sum((x - mean) ** 2 * y) / w
mean, variance, np.sqrt(variance)
(np.float64(9.910741960086369e-18),
np.float64(0.9999884597046453),
np.float64(0.9999942298356753))import matplotlib.pyplot as plt
def plot_gaussian(x, A=1.0, mu=0.0, sigma=1.0):
y = gaussian(x, A, mu, sigma)
w = np.sum(y)
mean = np.sum(x * y) / w
variance = np.sum((x - mean) ** 2 * y) / w
std = np.sqrt(variance)
print("Mean:", mean)
print("Variance:", variance)
print("Standard Deviation:", std)
plt.figure(figsize=(8, 4))
plt.plot(x, y, label=f'Gaussian: A={A}, μ={mu}, σ={sigma}')
plt.axvline(mean, color='r', linestyle='--', label='Mean')
plt.axvline(mean + std, color='g', linestyle='--', label='Std Dev')
plt.axvline(mean - std, color='g', linestyle='--')
plt.title('Gaussian Function')
plt.xlabel('x')
plt.ylabel('f(x)')
plt.grid()
plt.legend()
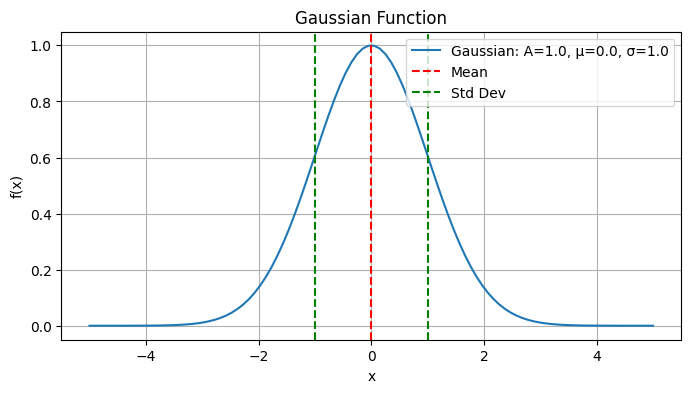
plt.show()x = np.linspace(-5, 5, 100)
plot_gaussian(x)Mean: 9.910741960086369e-18
Variance: 0.9999884597046453
Standard Deviation: 0.9999942298356753
In a more realistic scaling, where we have already observed in the Elutional View Section:
x = np.arange(300)
plot_gaussian(x, A=1.0, mu=150.0, sigma=30.0)
Mean: 149.99999256639813
Variance: 899.9865922690274
Standard Deviation: 29.99977653698486