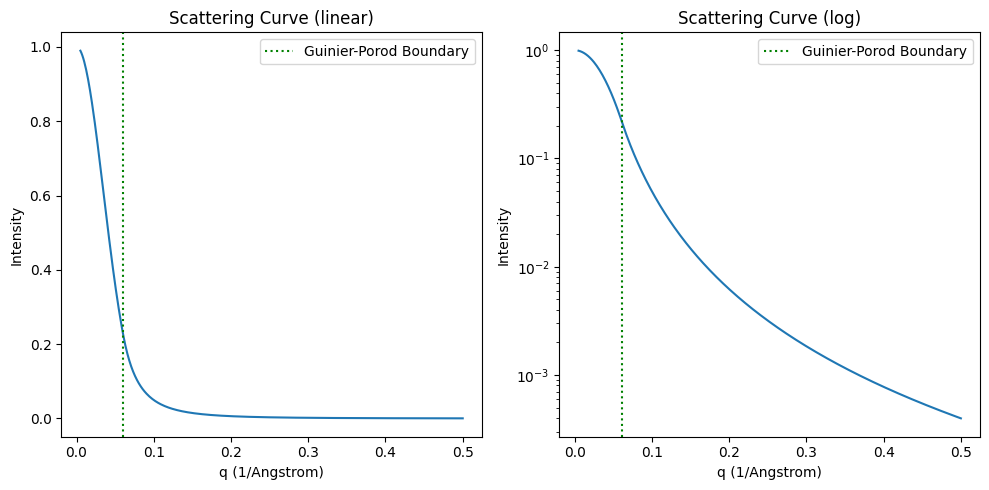
caveat: this model is only for tutorials, meaning not realistic as a protein model due to the lack of medium angle regions
import numpy as np
import matplotlib.pyplot as plt
from molass.SAXS.Models.Simple import guinier_porod

q = np.linspace(0.005, 0.5, 400)
G = 1
Rg = 35
d = 3
I, q1 = guinier_porod(q, G, Rg, d, return_also_q1=True)

fig, (ax1, ax2) = plt.subplots(ncols=2, figsize=(10, 5))
ax2.set_yscale('log')

for ax, yscale in ((ax1, 'linear'), (ax2, 'log')):
    ax.set_xlabel("q (1/Angstrom)")
    ax.set_ylabel("Intensity")
    ax.set_title(f"Scattering Curve ({yscale})")
    ax.plot(q, I)
    ax.axvline(q1, linestyle=':', color="green", label='Guinier-Porod Boundary')
    ax.legend()

fig.tight_layout()