Here are elution curves taken from the same data used above in the 3D view Figure 1. Although they seem similar, be aware that the same set of particles results in diffrent curves in corresponding measurements. The difference varies if you take another pair of picking points in each spectral axis.
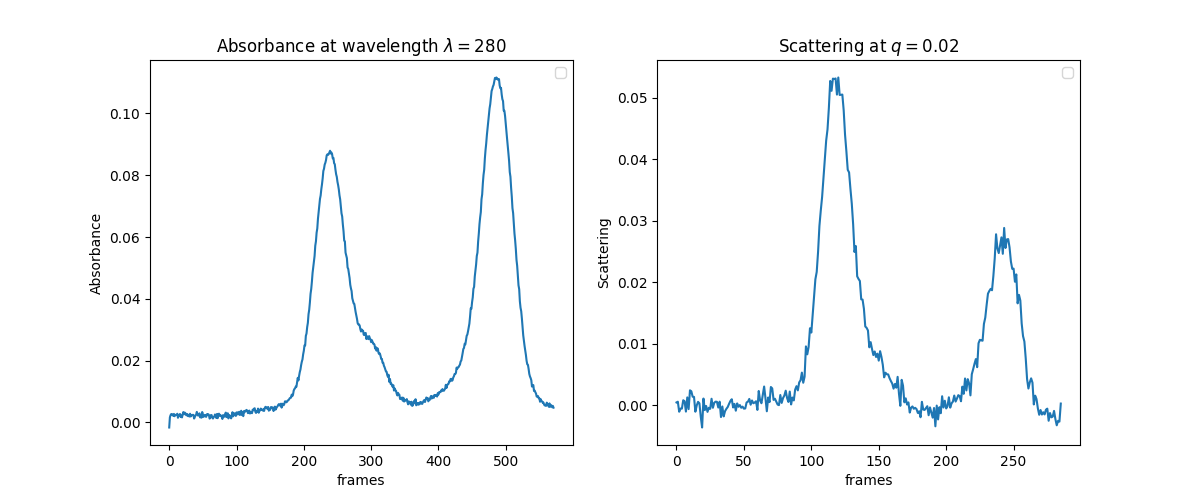
Figure 1:Elution Curves
It could be said as chromatographic since it depicts the separative nature of chromatography. In the animation below, particles of three different sizes, distinguished with colors, are injected at the top of column and flow downward with some of them taking occasional rests in the pores[1] of fixed substance.
Concerning the tendency of entering pores, smaller particles are like curious children while larger ones are like unconcerned adults. As a result, the larger hurry faster to the bottom of column, where concetraion of the particles is measured by both UV absorbance and X-ray scattering.[2]