Here are spectral curves taken from the same data used above in the 3D view Figure 1. In contrast to the elutional view, they are essentially different.
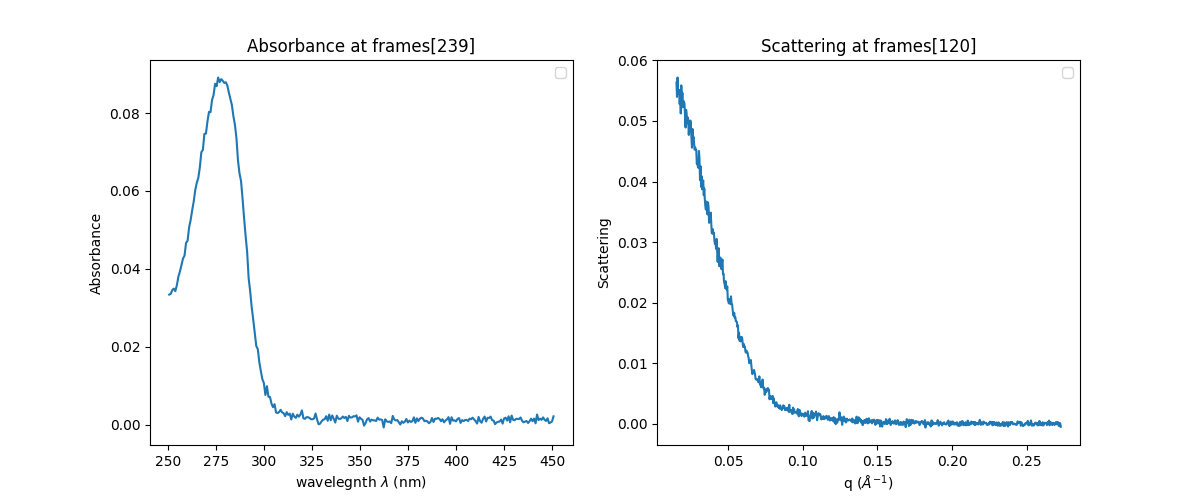
Figure 1:Spectral Curves
UV Absorbance Curve
In the spectral view of UV absorbance data, they are called absorbance curves.
The modeling of them is currently beyond our reach because, to the best of our knowledge, no usable models are available[1]. However, some computational chemistry packages[2] seem to be able to produce them at least for amino acids, suggesting such possibilities in the future.
X-ray Scattering Curve
In the spectral (or angular) view of X-ray scattering data, they are called scattering curves.
To give a theoretical flavor a little, here is an example of simplest case. In SAXS theory, it is known that a detector image is a spherical average of squared absolute values of Fourier transform of an object, which is represented in electron density.[3] These four related sets of data are depicted in the following firure, in case where the particle shape is equally an ellipsoid.
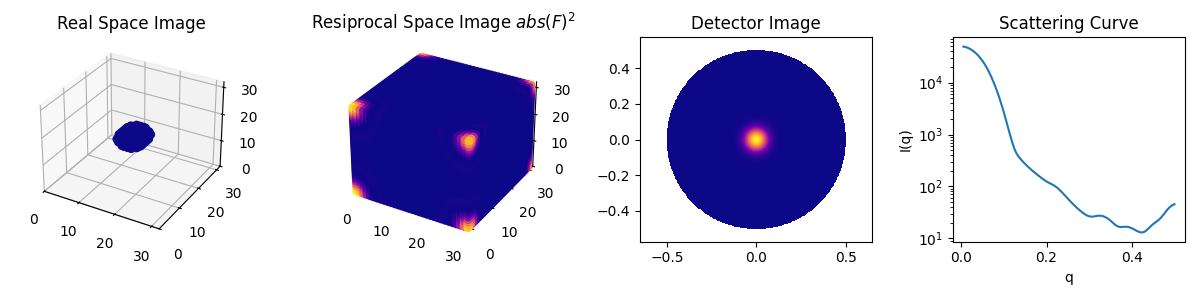
Figure 2:SAXS Illustraion through Fourier Transform of a homogeneous Ellipsoid
We will cover briefly the modeling of scattering curves later in Chapter 6.
in the sense that you can use easily on personal computers.
Psi4, PySCF, etc.
Molass Librarycurrently does not directly utilize this relation, whileDENSSGrant, 2018 is an excellent application of its smart use, from which we learned coding for the figures.
- Grant, T. D. (2018). Ab initio electron density determination directly from solution scattering data. Nature Methods, 15(3), 191–193. 10.1038/nmeth.4581