Consider how the sizes of particles with different shapes can be compared. can be used for that purpose.
is computed (defined) as follows:
compute the center of mass (or density)
compute the weighted average of squared deviation from the center
compute the square root of the above avarage
Using the known formula for , the next code computes Rg’s of several ellipsoids with different lenghts of semi-axes, , and .
import numpy as np
import matplotlib.pyplot as plt
from molass.Shapes import Ellipsoid
from molass.DensitySpace import VoxelSpace
from molass.SAXS.Simulator import compute_saxs, draw_saxs

fig, axes = plt.subplots(nrows=2, ncols=4, figsize=(16, 8), subplot_kw=dict(projection='3d'))

for i in range(2):
    for j in range(4):
        ax = axes[i, j]
        a = 16 * (2 - i)
        b = 8 * (i + 1)
        c = 2 * ((i + 1)*(j + 1))
        rg = np.sqrt((a**2 + b**2 + c**2)/5)
        ax.set_title(f'(a, b, c)={(a, b, c)}; $R_g={rg:.1f}$')
        ellipsoid = Ellipsoid(a, b, c)
        space = VoxelSpace(64, ellipsoid)
        space.plot_as_dots(ax)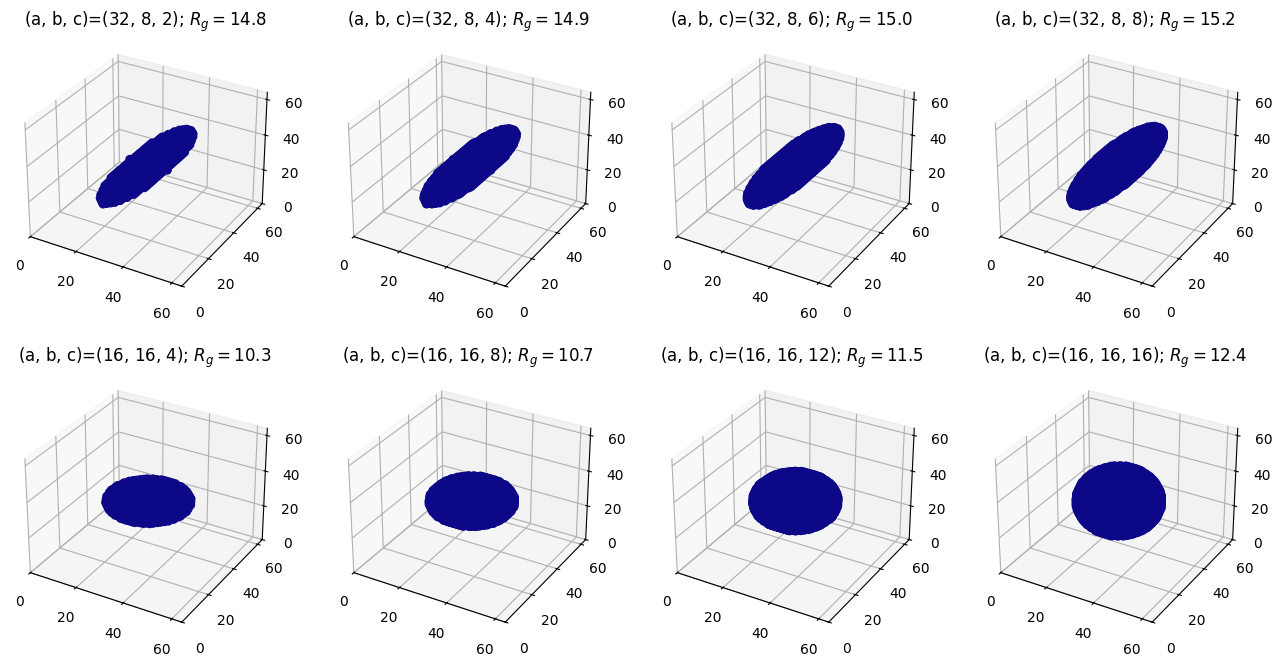
In the above plot, the shapes are defined with uniform density, meaning the density is uniformly one throughout each shape. The next plot illustrates this fact more clearly.
import numpy as np
import matplotlib.pyplot as plt
from molass.Shapes import Ellipsoid
from molass.DensitySpace import VoxelSpace

fig, axes = plt.subplots(ncols=2, figsize=(10,5), subplot_kw=dict(projection='3d'))
a, b, c = 16, 16, 16
ellipsoid = Ellipsoid(a, b, c)
space = VoxelSpace(64, ellipsoid)
space.plot_with_density(axes)
fig.tight_layout()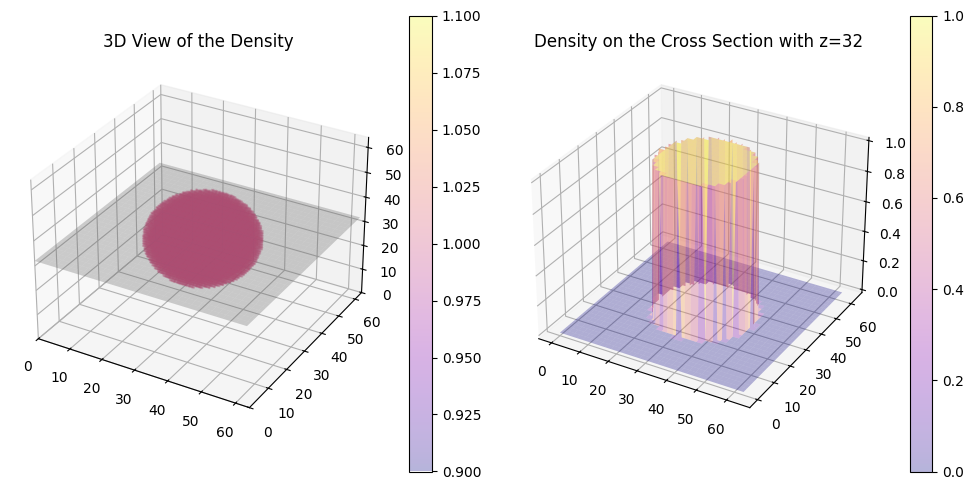
Next method computes without using the formula, namely by computing the square root of the weighted average of the squared deviations from the center.
space.compute_rg()np.float64(12.373697563931419)Confirm the concept with another plot that depicts a sphere with a Gaussian (non-uniform) density distribution.
from molass.DensitySpace import VoxelSpace
from molass.DensitySpace.Densities import gaussian_density_for_demo
fig, axes = plt.subplots(ncols=2, figsize=(10,5), subplot_kw=dict(projection='3d'))

N = 64
density = gaussian_density_for_demo(N)
space = VoxelSpace(N, density=density)
space.plot_with_density(axes)
fig.tight_layout()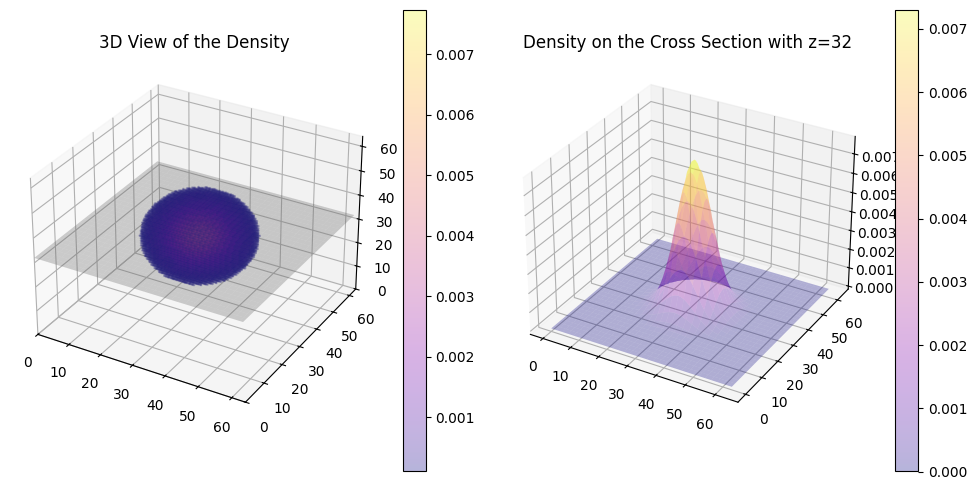
Compare this with the previous result.
space.compute_rg()np.float64(9.486832051163836)