The legacy MOLASS program produces its analysis results in Excel books. We will explain here how to do the same in Molass Library.
Learning Points
rgcurve = ssd.xr.compute_rgcurve()
ranges = decomposition.get_paired_ranges()
decomposition.plot_components(rgcurve=rgcurve, ranges=ranges)
rgcurve_atsas = ssd.xr.compute_rgcurve_atsas()
mapping = ssd.estimate_mapping()
conc_info = ssd.make_conc_info(mapping)
rg_info = rgcurve, rgcurve_atsas
make_v1report(ssd, conc_info=conc_info, rg_info=rg_info, lr_info=decomposition, ranges=ranges)
Preparation for the Report
Although it is possible to do it as well without any preparation (that is, implicitly all by default), we will show explicitly what to prepare in the hope that it will better serve as explanation and can be easy to modify.
First, we will prepare rg curves and analysis ranges.
from molass import get_version
assert get_version() >= '0.7.5', "This script requires molass version 0.7.5 or higher."
from molass_data import SAMPLE1
from molass.DataObjects import SecSaxsData as SSD
ssd = SSD(SAMPLE1)
trimmed_ssd = ssd.trimmed_copy()
corrected_ssd = trimmed_ssd.corrected_copy()
decomposition = corrected_ssd.quick_decomposition(num_components=3)
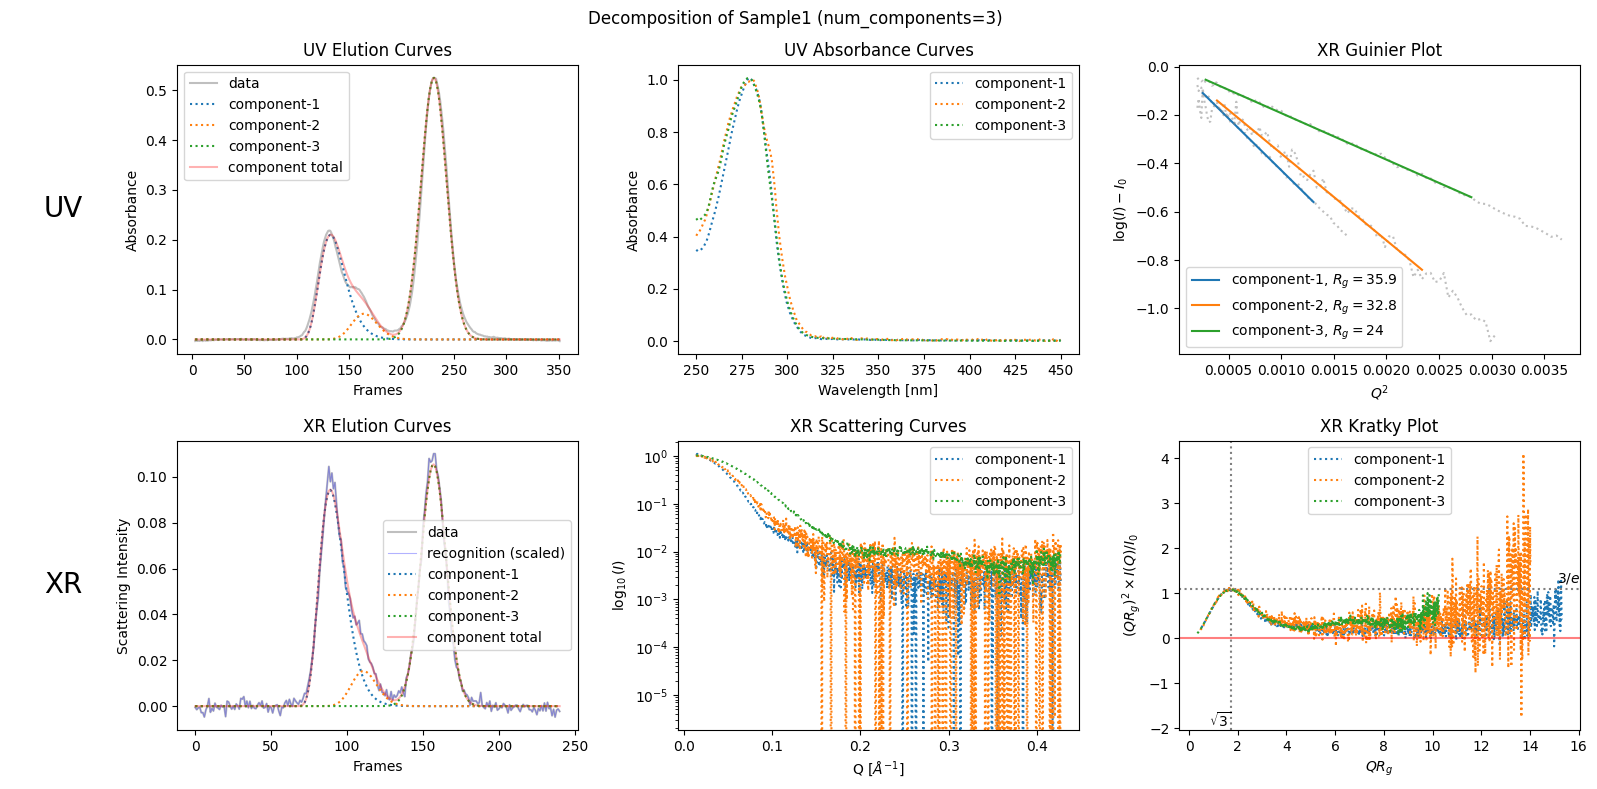
plot5 = decomposition.plot_components(title="Decomposition of Sample1 (num_components=3)")
zeros at the angular ends of error data have been replaced with the adjacent values.
rgcurve = corrected_ssd.xr.compute_rgcurve()
plot6 = decomposition.plot_components(title="Decomposition of Sample1 with Rg Curve", rgcurve=rgcurve)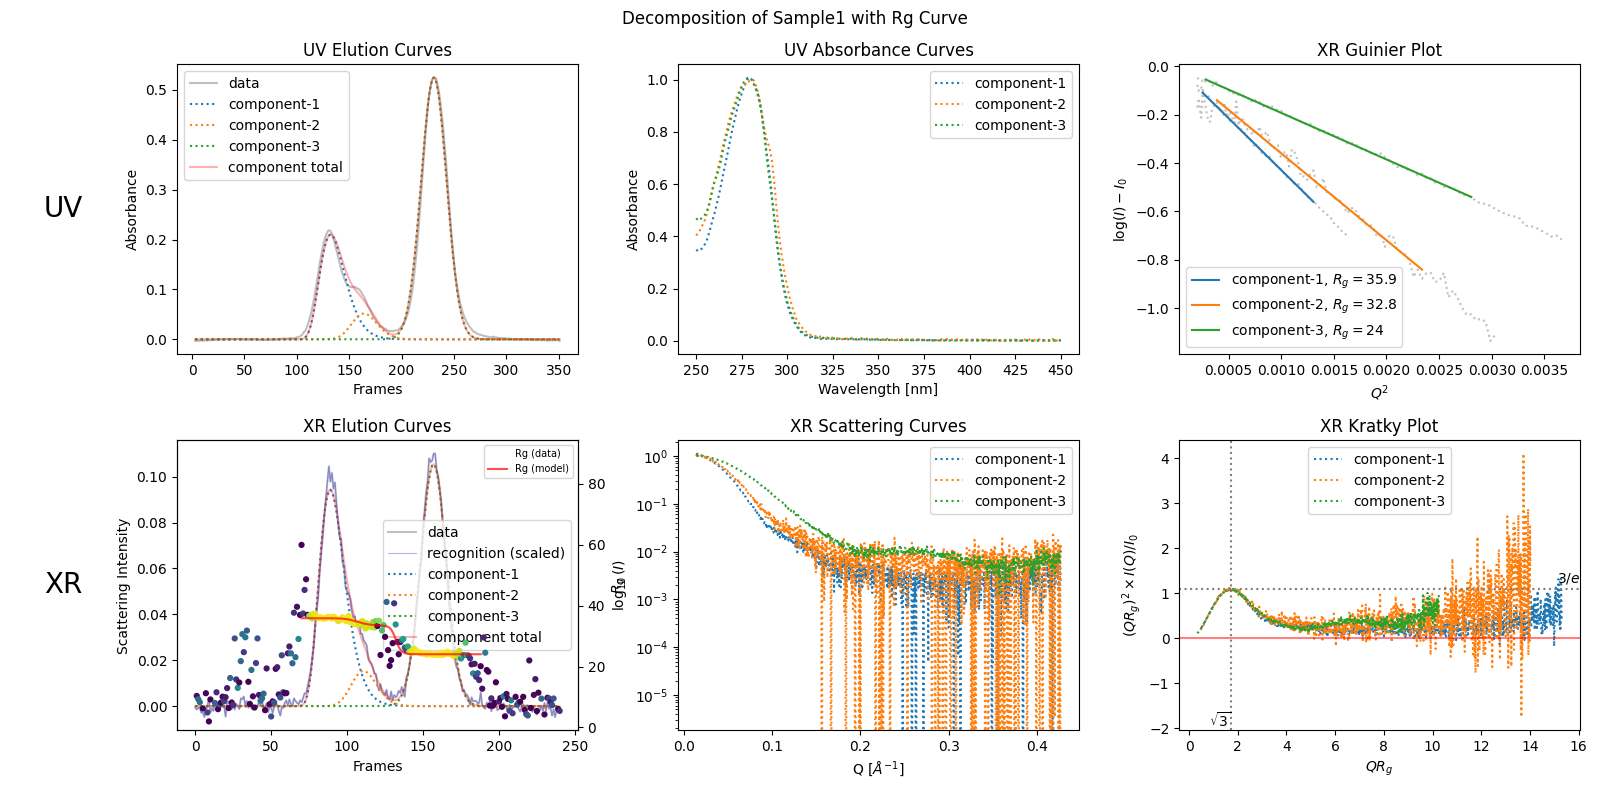
pairedranges = decomposition.get_pairedranges()
plot8 = decomposition.plot_components(title="Decomposition of Sample1 with Rg Curve and Paired Ranges", rgcurve=rgcurve, pairedranges=pairedranges)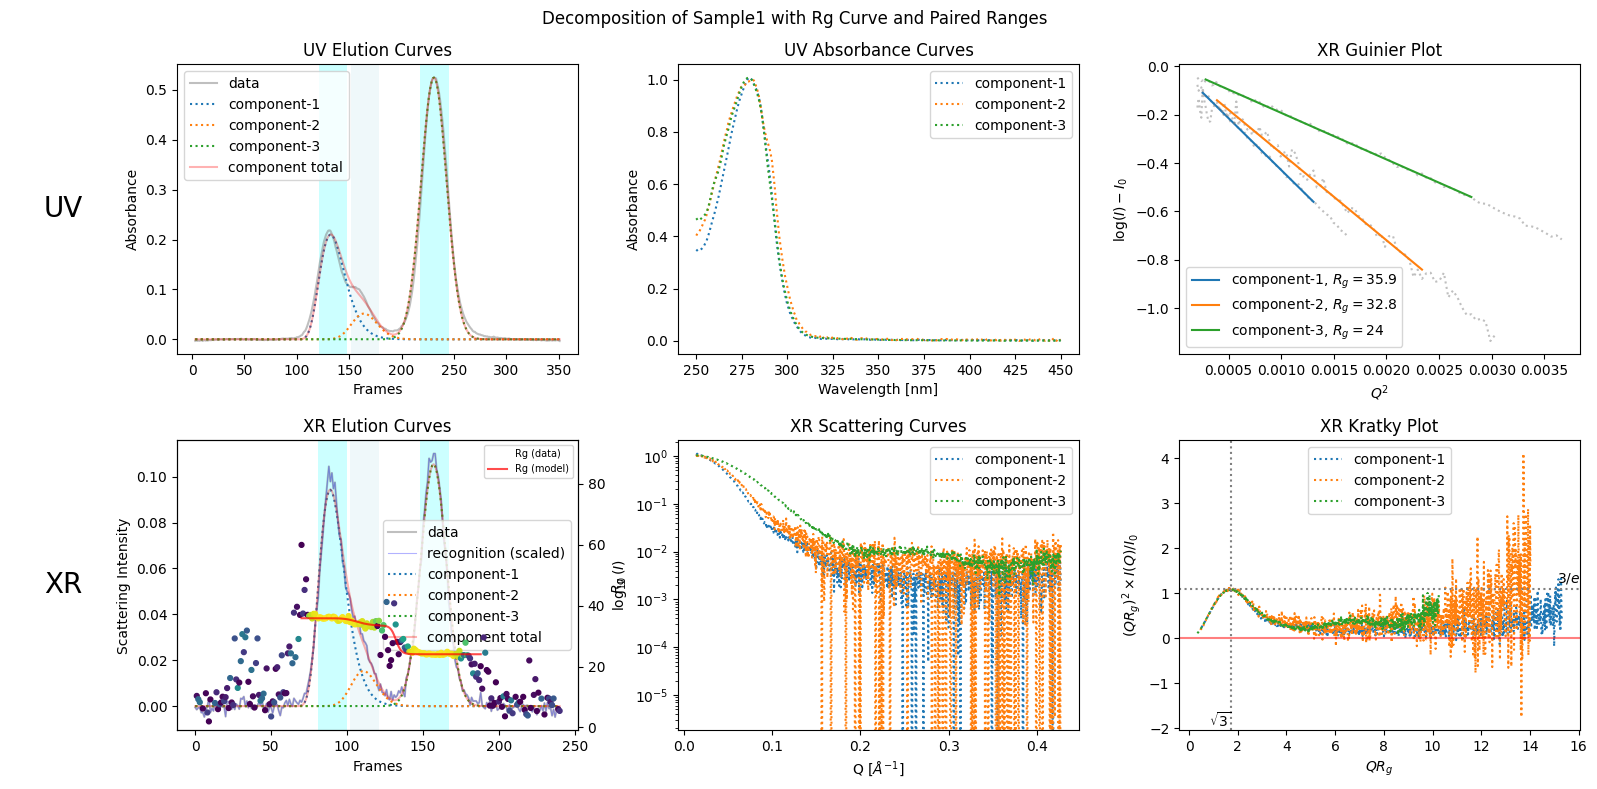
rgcurve_atsas = corrected_ssd.xr.compute_rgcurve_atsas()Making the Excel Report
To make the report, we also need the concentration information which can be prepared as follows.
%%capture
from molass.Reports.V1Report import make_v1report

rgcurves = rgcurve, rgcurve_atsas
make_v1report(corrected_ssd, rgcurves=rgcurves, decomposition=decomposition, ranges=pairedranges)
⚠️ Important Warning
openpyxl>=3.1.4 causes Excel formatting troubles. Be sure to use openpyxl<=3.1.3 for this feature.
Note: Due to a VS Code Insiders rendering bug (v1.127.0, commit 0d2dfb2), the warning cell above this horizontal rule may not be visible in the editor, but it does exist in the file and renders correctly in the published documentation.