import numpy as np
import matplotlib.pyplot as plt
from molass_data import SAMPLE1
from molass.DataObjects import SecSaxsData as SSD
ssd = SSD(SAMPLE1)
x, y = ssd.xr.get_icurve().get_xy()
fig, ax = plt.subplots()
ax.plot(x, y)
plt.show()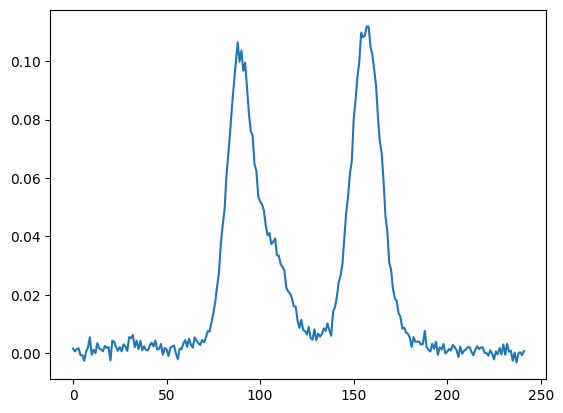
csv_path = "hplc-py-example.csv"
np.savetxt(csv_path, np.column_stack((x/20, y)), delimiter=",", header="time,signal", comments='')
from hplc.io import load_chromatogram
from hplc.quant import Chromatogram
example = load_chromatogram(csv_path, cols=['time', 'signal'])
chrom = Chromatogram(example)
chrom.show()[<Figure size 640x480 with 1 Axes>, <Axes: xlabel='time', ylabel='signal'>]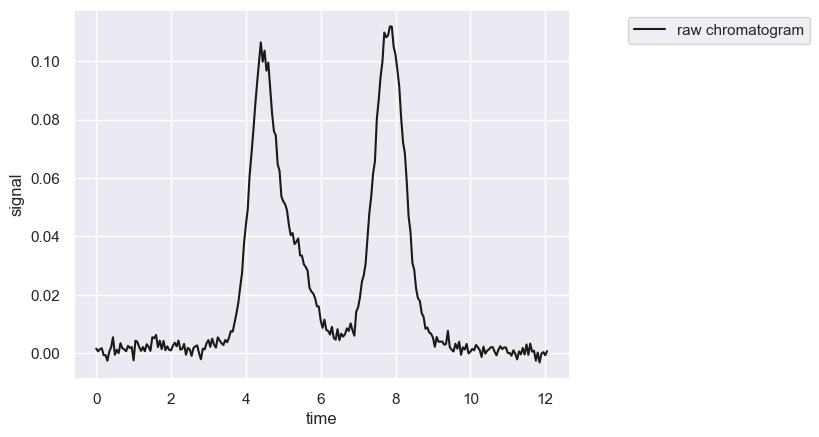
peaks = chrom.fit_peaks(prominence=0.05)
peaks.head()
Performing baseline correction: 0%| | 0/49 [00:00<?, ?it/s]Performing baseline correction: 100%|██████████| 49/49 [00:00<00:00, 7525.76it/s]
Deconvolving mixture: 0%| | 0/1 [00:00<?, ?it/s]Deconvolving mixture: 100%|██████████| 1/1 [00:01<00:00, 1.72s/it]Deconvolving mixture: 100%|██████████| 1/1 [00:01<00:00, 1.72s/it]
Loading...
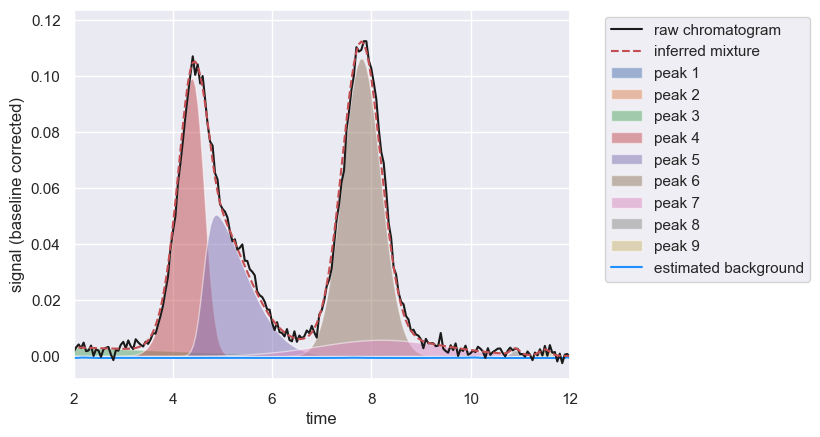
chrom.show([2, 12])[<Figure size 640x480 with 1 Axes>,
<Axes: xlabel='time', ylabel='signal (baseline corrected)'>]