Overview of the Data
The data set used here for explanation looks like this.
import numpy as np
import matplotlib.pyplot as plt
from molass.Local import get_local_settings
from molass.DataObjects import SecSaxsData as SSD
local_settings = get_local_settings()
PKS_DATA = local_settings['PKS_DATA']
ssd = SSD(PKS_DATA)
ssd.plot_3d();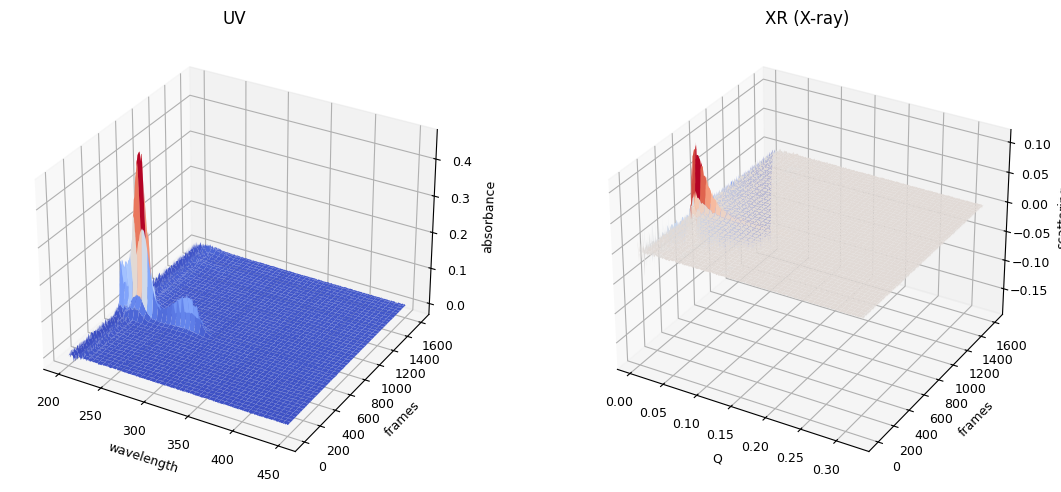
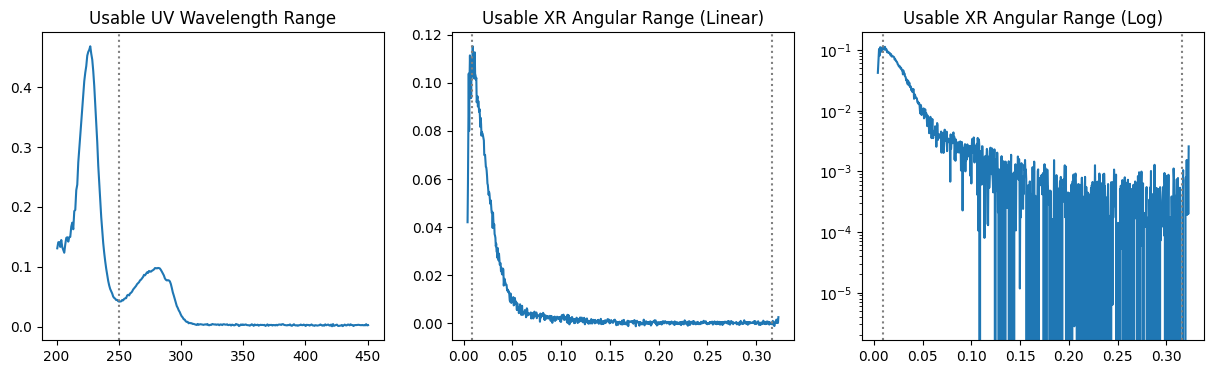
Trimming in Spectral Axis
# ssd from sample_data
fig, (ax1,ax2,ax3) = plt.subplots(ncols=3, figsize=(15,4))

ax1.set_title("Usable UV Wavelength Range")
i, j = ssd.uv.get_usable_wrange()
uv_icurve = ssd.uv.get_icurve()
k = np.argmax(uv_icurve.y)
uv_jcurve = ssd.uv.get_jcurve(j=k)
ax1.plot(uv_jcurve.x, uv_jcurve.y)
for n in i, j:
    if n is not None:
        ax1.axvline(uv_jcurve.x[n], ls=":", color='gray')

ax2.set_title("Usable XR Angular Range (Linear)")
ax3.set_title("Usable XR Angular Range (Log)")
ax3.set_yscale('log')
i, j = ssd.xr.get_usable_qrange()
xr_icurve = ssd.xr.get_icurve()
k = np.argmax(xr_icurve.y)
xr_jcurve = ssd.xr.get_jcurve(j=k)
for ax in ax2,ax3:
    ax.plot(xr_jcurve.x, xr_jcurve.y)
    for n in i, j:
        if n is not None:
            ax.axvline(xr_jcurve.x[n], ls=":", color='gray')